


How we divided our Node.js API latency by leveraging our Database Connection Pool
Having spent a few hours understanding and properly configuring our Database Connection Pool helped us divide our maximum API latency by three.
We learned a lot through the process and wanted to share our insights.
Here is everything you need to know on why and how to leverage a Database Connection Pool to speed up your Node.js API.
Symptoms and Customer Impact
We've always been monitoring our services as they are perceived from our customers' point of view, and we're defaulting to the Four Golden Signals when it comes to select metrics.
- Error rate: is it working properly?
- Latency: is it working fast enough?
- Traffic: how much is it used?
- Saturation: how much is it full?
Recently, we've integrated a few new customers, and while we were prepared and confident about our capacity planning, the higher end of our API latency (P99 and MAX) started to show unexpectedly high values.
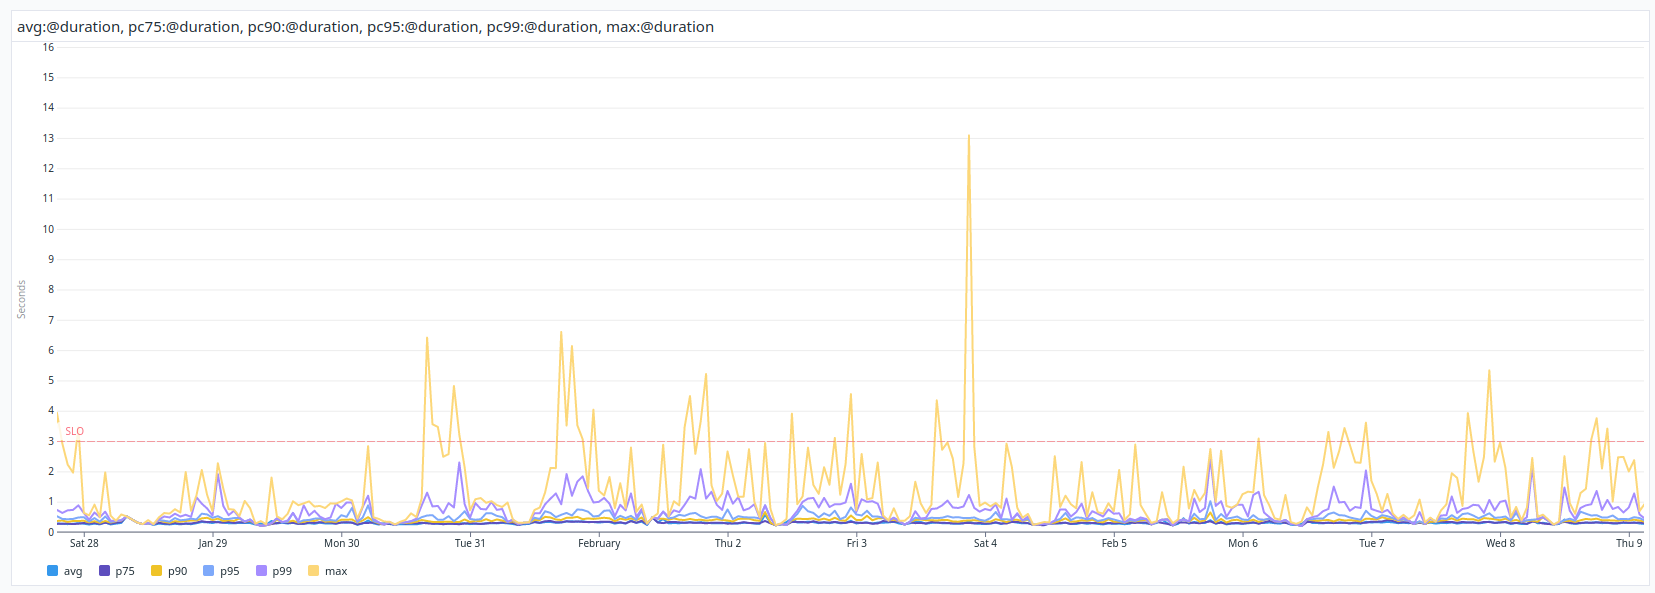
As we investigated the root cause, our customers contacted us about an increasing amount of timeout errors.
Further investigations highlighted that those spikes were due to some SQL queries being slower than usual on a random pattern.
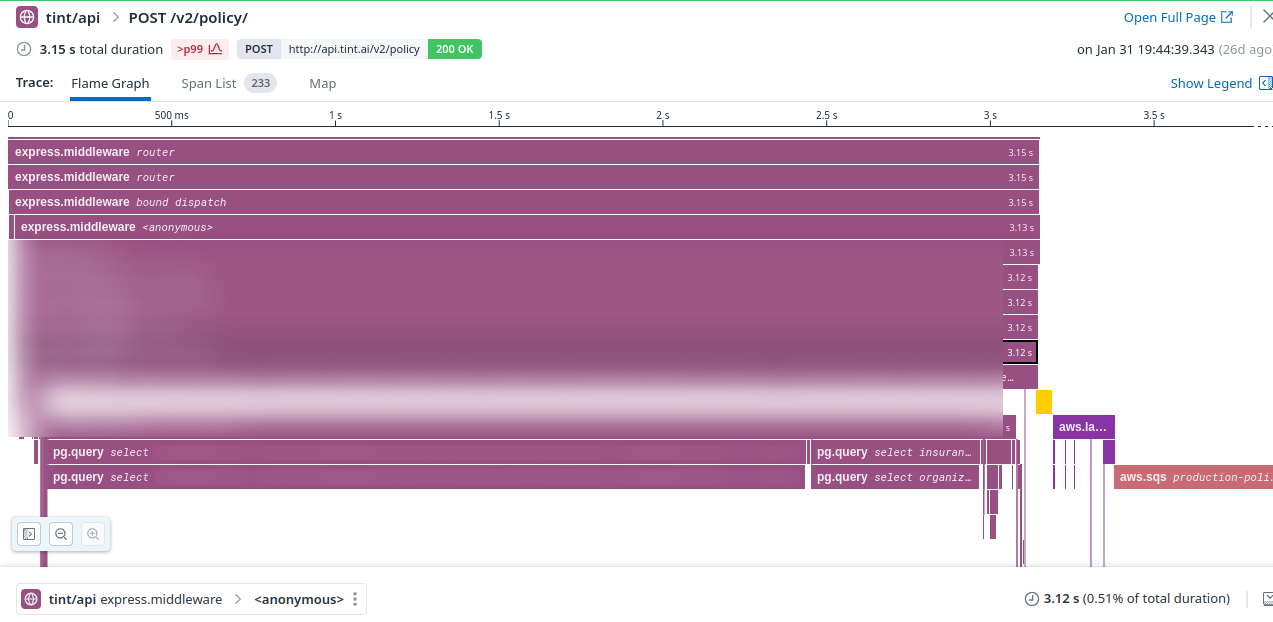
Note: We're using Datadog as an observability tool, which has been extremely useful throughout the investigation.
As you might see, the first database queries are taking up to two seconds, whereas they're taking a few milliseconds most of the time.
Intuitively, we were assuming there was something wrong with our Database Connection pool, especially as we never took the time to configure it correctly. But at this point, it was just an intuition.
Why connection pooling in the first place
Opening and closing connections to the database is a heavy and slow operation. Creating a single connection can take from a few dozen milliseconds to a few seconds depending on your network, database, load, etc.
Most of the time, Software Engineers are using a full-fledged database client or ORM that handles connections for them, and they don't want to think about it. They want to deliver new features quickly, and they're right to do so.
Doing connection pooling allows to keep and reuse already open connections for other requests. Open once, query multiple times.
In our case, we're using knex as a query builder to reach our PostgreSQL database.
Parallel queries need more connections
Moreover, due to the nature of our internal API (a GraphQL server), each subset of our request is processed in parallel (within resolvers).
The more queries are run in parallel, the more you'll need to have connections open and ready in your pool.
import knex from 'knex';

const client = knex();

// Will open two connections because promises in `Promise.all` are run in parallel
const [user, books] = await Promise.all([
    client('users').where('id', id),
    client('books').where('authorId', id);
]);
Note: In GraphQL resolvers, we can make good use of dataloader to batch database queries and reduce the number of database connections.
Monitoring the pool
Our first thought was that the database was running out of available connections. Hence, we decided to increase this number to mitigate the issue as fast as possible, before further investigations. However, this guess was not successful: we needed more visibility in our database connection pool.
Database Connection Lifecycle in the Pool
Our query builder library, knex, is using tarn.js to handle the connection pooling.
It's a really simple and lightweight library, its API can be summarized as follows.
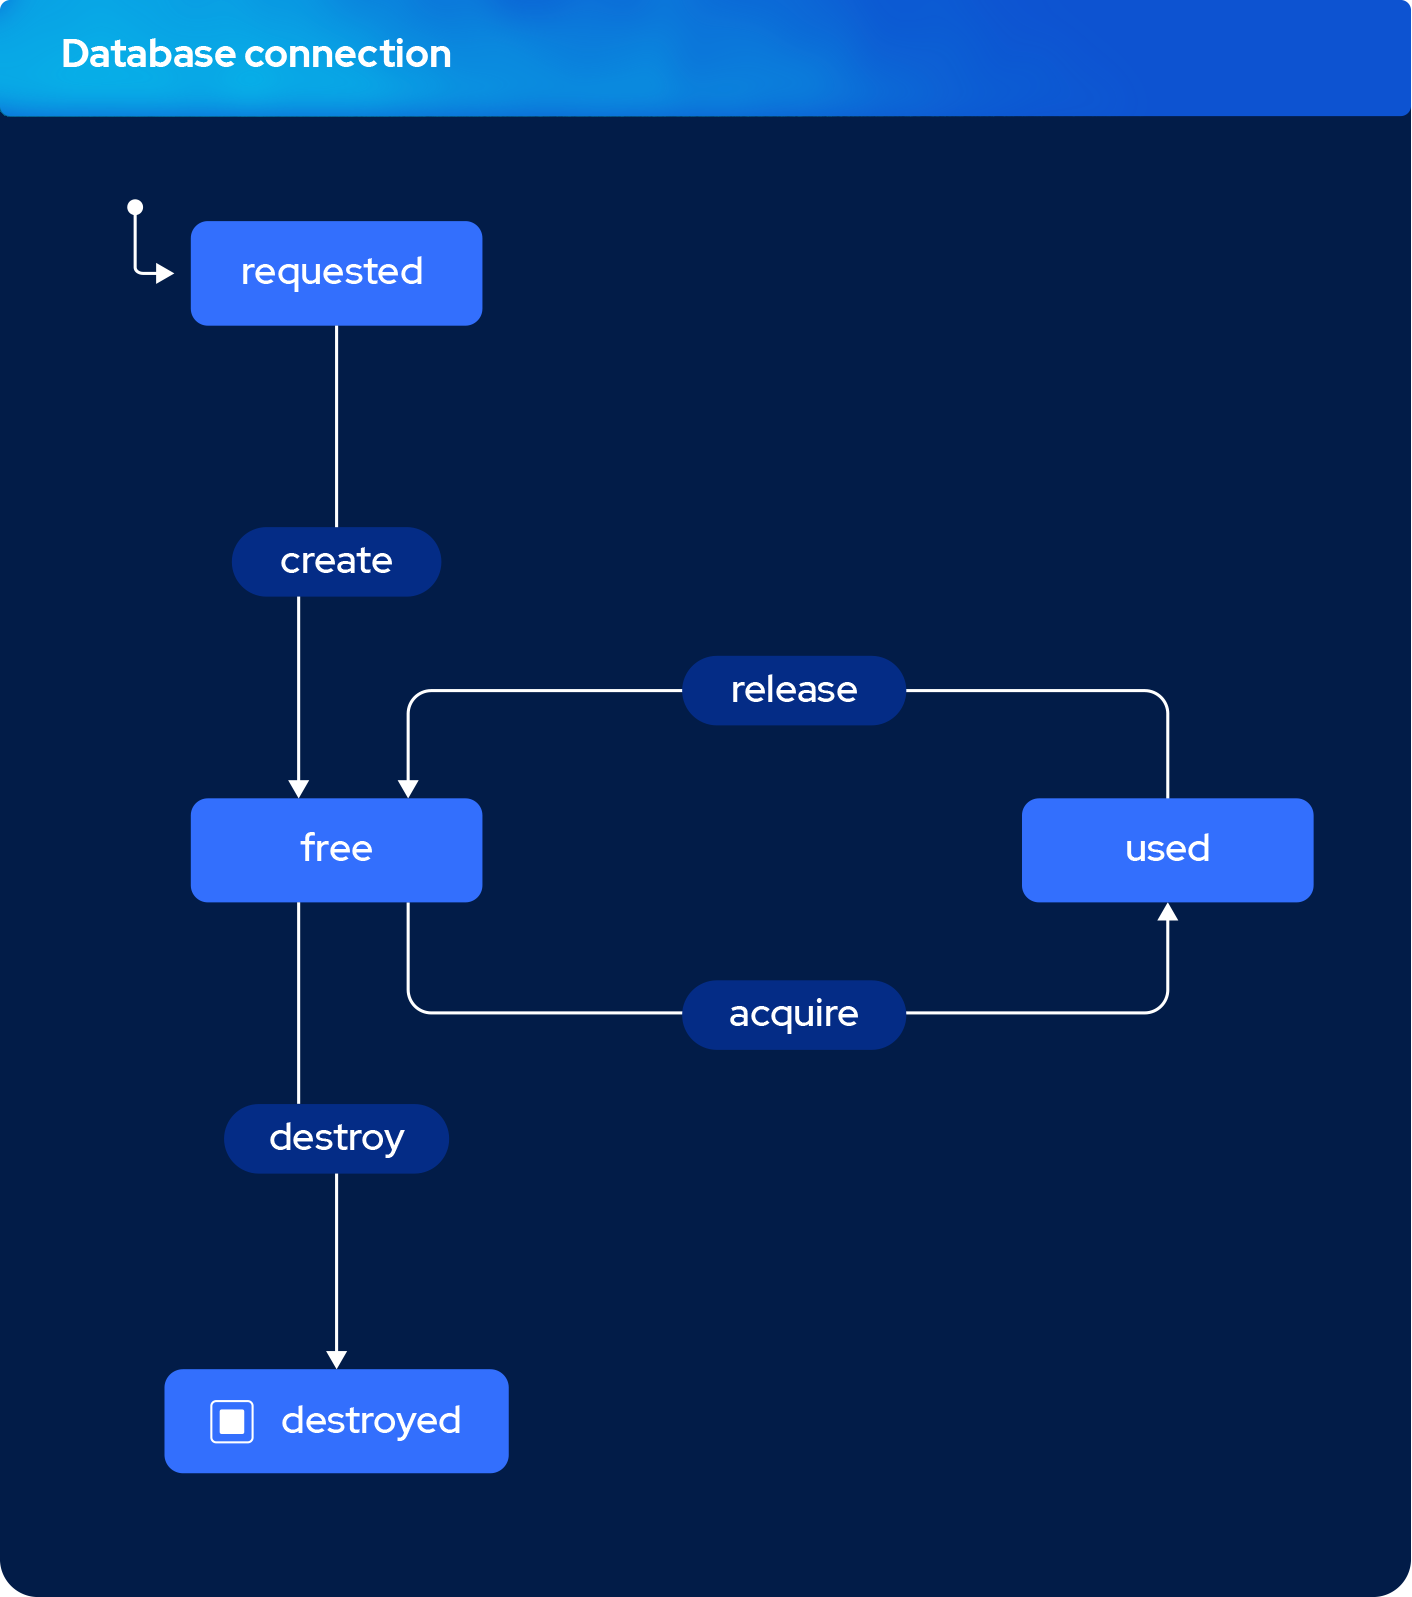
Whenever the query builder needs to perform a query it can either acquire a FREE connection.
If no connection is FREE then it needs to create one and then acquire it.
create()open a new connection and tag it asFREE,acquire()reserve the connection and tag it asUSED,- after a query is run, the pool
release()it and tag it asFREEagain, - if the connection hasn't been used for a duration called idle timeout it's being destroyed.
Tracking the pool's usage
tarn.js is providing an event emitter to track down each connection.
We leveraged its API to measure a few metrics that helped us understand the pool behavior.
import knex from 'knex';
import metrics from 'datadog-metrics';

const gaugeConnections = (pool) => () => {
    metrics.gauge('db_connections_used', pool.numUsed());
    metrics.gauge('db_connections_free', pool.numFree());
    metrics.gauge('db_connections_pending_creation', pool.numPendingCreates());
    metrics.gauge(
        'db_connections_pending_detroy',
        pool['pendingDestroys'].length
    );
};

const client = knex();

client.pool.on('createSuccess', gaugeConnections(pool));
client.pool.on('acquireSuccess', gaugeConnections(pool));
client.pool.on('release', gaugeConnections(pool));
client.pool.on('destroySuccess', gaugeConnections(pool));
The code above helps with monitoring both the total number of used and free connections at any time, but also the number of created and destroyed connections, which helps understanding the efficency of the pool.
Less the pool is opening/creating connections during an API request, the better.
Our pool behavior through usual workload
To our big surprise, the connection pool was far from being full, quite the opposite! Only a fraction of our connections are being used at all time.
Indeed, increasing the maximum number of connections has not helped in this situation.
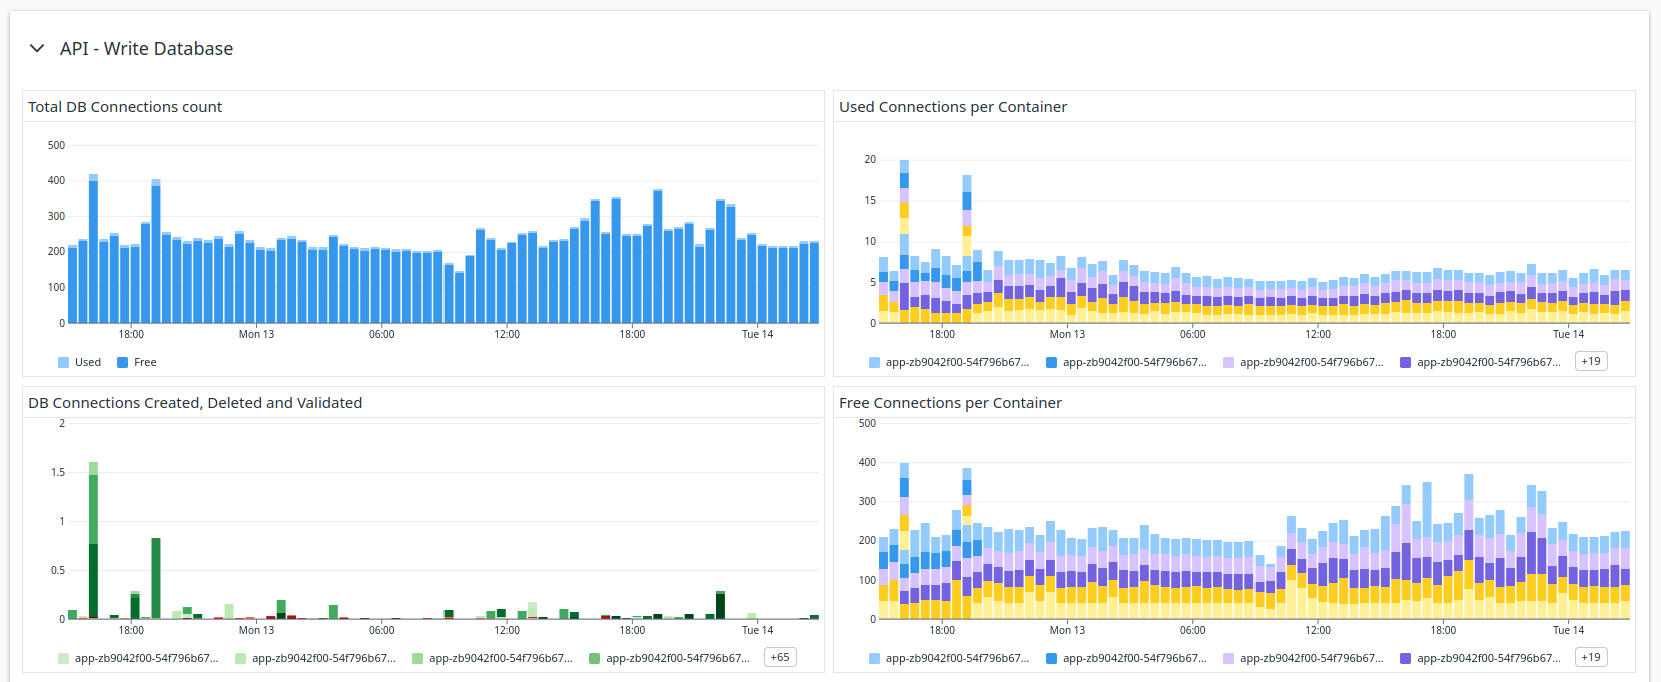
There are two information that are worth noting on the charts above:
- The total number of connections is always moving
- The pool is spending a lot of time creating new connections (the green bars)
The pool was not configured correctly because it was constantly deleting and opening new connections, slowing our API requests.
Adjusting our Database Connection Pool usage
Here are all the adjustments we done to our pool. Those changes are specific to our situation, and I wouldn't recommend to blindly.
Increasing the idle timeout duration
Since the pool was constantly creating new connections, an easy and obvious step is to increase the idle timeout duration. That way, the connections will stay longer in the pool and stay available when needed.
We've seen some improvement increasing the idle timeout from 10 minutes to 30 minutes.
This change had a significant impact during the US days, because we have a high and constant flow of API requests during this time.
const client = knex({
    client: 'pg',
-   idleTimeoutMillis: 600000, // 10 minutes
+   idleTimeoutMillis: 1800000, // 30 minutes
});
On the opposite, I'm recommending to get the following values as low as possible: createTimeoutMillis, acquireTimeoutMillis, and destroyTimeoutMillis.
They are configured at 30 seconds by default for legacy reasons, but it's a really long time to wait to retry a connection.
Note: Usually, when working with timeout durations, it's better to reduce them instead of increasing them, in order to let the system recover quickly, and attempt a retry for example. This is not the case for
idleTimeoutMillis.
Make sure to monitor those durations as well, and chop off the outliers.
Background Connection Pool Warmup
While increasing the idle timeout helped with the US day, we still had surge of slow API requests in the US morning, when the number of requests starts to grow, and when handling traffic spikes.
For those reasons and based on historical data, we decided to warm up the pool and refresh the connections in the background so that we constantly keep a high enough number of connections ready for when spikes come.
Background warmup and refresh has two advantages for us:
- it opens connections in the background, so the API requests no longer have to open them
- we can control the our connection number basis per configuration, simplifying our capacity planning
In practice, the simplified warm up looks like this:
const client = knex();
const warmUpConnectionsNumber = parseInt(
    process.env.DB_POOL_WARM_UP_CONNECTION_NUMBER,
    10
);

if (warmUpConnectionsNumber) {
    // Create and acquire some DB connections even before the API is ready
    const warmUpConnectionPool = async () => {
        const connections = Array.from({ length: warmUpConnectionsNumber });

        await Promise.all(connections.map(async () => client.raw('SELECT 1')));
    };

    // Warm up at cold start, so that the first API call don't even have to open one connection
    warmUpConnectionPool();

    // Warm up on a regular basis, we choose to do it every 25 minutes
    const interval = setInterval(
        warmUpConnectionPool,
        parseInt(process.env.DB_POOL_WARM_UP_INTERVAL, 10)
    );

    // Stop the warmup when the API is being shut down
    const gracefulShutdown = () => clearInterval(interval);
    process.on('SIGINT', gracefulShutdown);
    process.on('SIGTERM', gracefulShutdown);
}
No minimum connections
By default, tarn.js is configured to keep at least two connections open at all time for legacy reasons.
Firstly, for any production application, two connections is a ridiculous amount.
Then, it can cause some problems with stale / broken connections as tarn.js is selecting arbitrarily which connections should stay open.
From the knex documentation:
Note that the default value of min is 2 only for historical reasons. It can result in problems with stale connections, despite tarn's default idle connection timeout of 30 seconds, which is only applied when there are more than min active connections. It is recommended to set min: 0 so all idle connections can be terminated.
Finally, as we choose to refresh the connections in the background, it doesn't makes sens for us to let tarn.js do it.
This seemed counterintuitive at first, but it worked well for us.
const client = knex({
    client: 'pg',
-   min: 2,
+   min: 0,
});
Managing maximum connections
Since we defined a baseline number of always open database connections, and this baseline is supposed to be higher than the maximum connections usage, do we still need to define a maximum connections allowed in the pool?
The short answer is yes.
The baseline has been checked against historical data, but it's still possible that a burst of API requests break the baseline. Those API requests will become slower than usual, and be throttled in a way, which is a good way to handle unexpected bursts.
Also, your database only supports a certain number of connections in parallel, after what it can't accept them anymore.
For example, for PostgreSQL you can retrieve this value with the following query:
select * from pg_settings where name = 'max_connections';
It's up to you to make sure that ALL the database consumers combined never reach this threshold. It is an important data to take into account for your capacity planning.
We've setup a maximum number of maximum connections that respects the following formula: MAX_CONNECTIONS * NODE PROCESS * API CONTAINER < MAX_POSTGRES_CAPACITY. Not counting the background jobs and other services here for simplicy's stake.
const client = knex({
    client: 'pg',
+   min: Math.floor(
+       MAX_POSTGRES_CAPACITY / API_PROCESSES_NUMBER
+   ),
});
If you ever need more than connections than that, you can explore other solutions like increasing your database size or installing a PgBouncer in front of it.
Results
Our API requests are no longer opening database connections but just acquiring them.
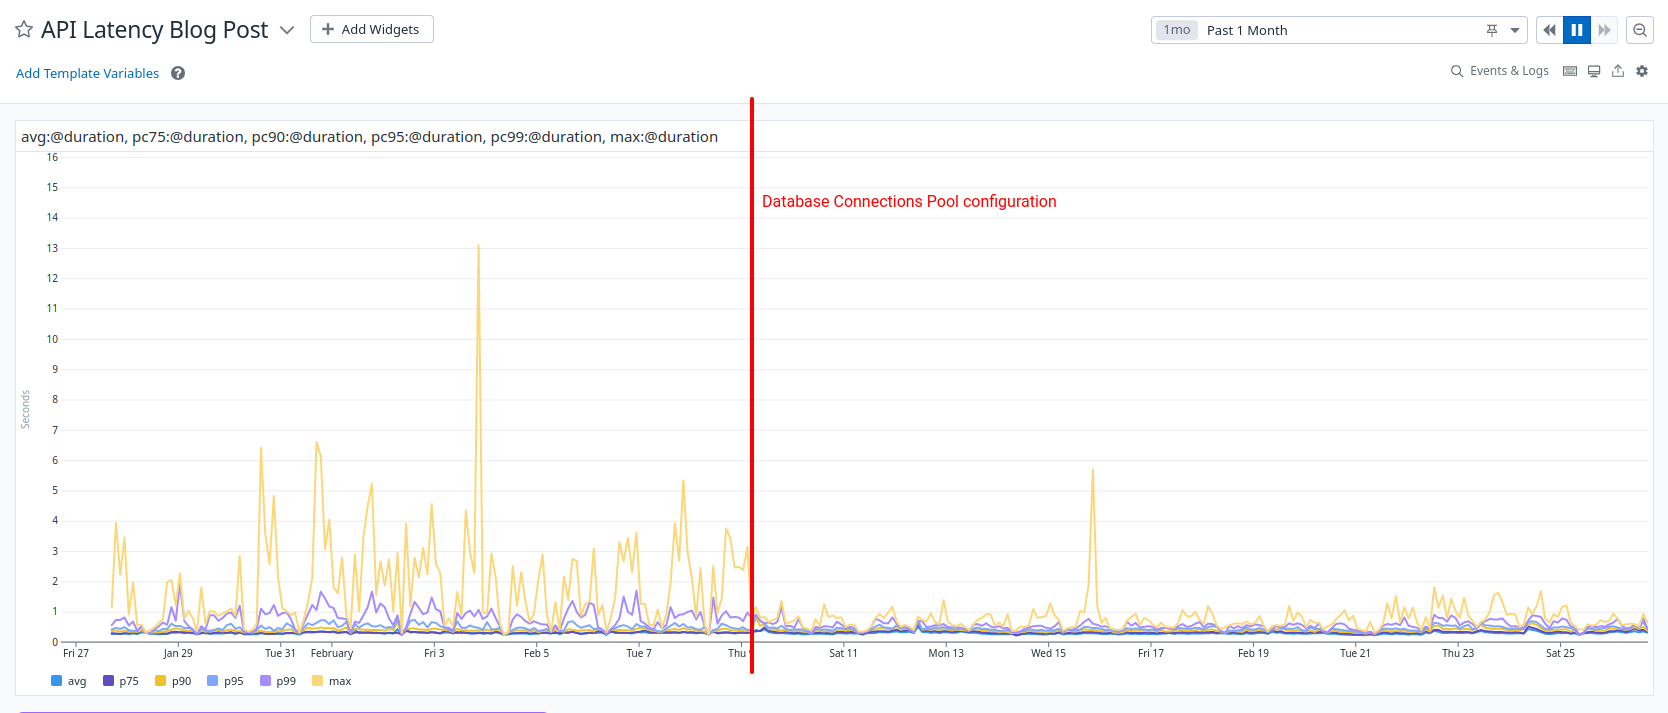
Their response time has become more predictable, closer to the average response time, and we're more confident in our capacity planning.
We managed to divide our maximum API latency, from three to one second.